






The storm, span by span
Regional data describes the storm. Local data explains the damage. Gill measures gusts, rain and temperature at the towers, spans and line exits where a network actually takes the weather.
Why there?
After a major storm, the question is usually why a handful of sites took severe damage while the wider region came through. Regional observations describe the storm as a whole. They rarely tell you what the gusts were at those particular towers, spans and substations.
A record of what each site experienced. Real-time gusts, preceding rainfall and, where reliable data exists, icing conditions, on one timeline with outage and damage records.
Evidence for where to harden next. Each event adds to a local history of what actually causes damage on the network, which helps prioritise hardening and storm preparation where it will count.
Local measurements turn a storm into evidence
Local measurements are one input to storm analysis, alongside vegetation, asset age and condition, design standards and the storm itself. The variables that matter are the obvious ones once you say them out loud.
Real-time wind gusts at the site. Measured at structure or conductor height, not at an airport twenty miles away.
Preceding precipitation. Wet ground and earlier rain change how structures and vegetation respond to wind.
Icing, where data exists. Ice accretion on conductors is genuinely difficult to measure, so treat it as an area to watch. Heated wind sensors keep reporting the wind when it matters.
Wildfire risk and field safety. Wind, gusts, temperature and humidity at the site give existing fire-weather procedures and work-at-height decisions site-specific inputs instead of a regional estimate.
Where a network takes the weather
Storm damage happens at one tower, one span, one yard. Each point below shows what is measured there and which sensing fits.
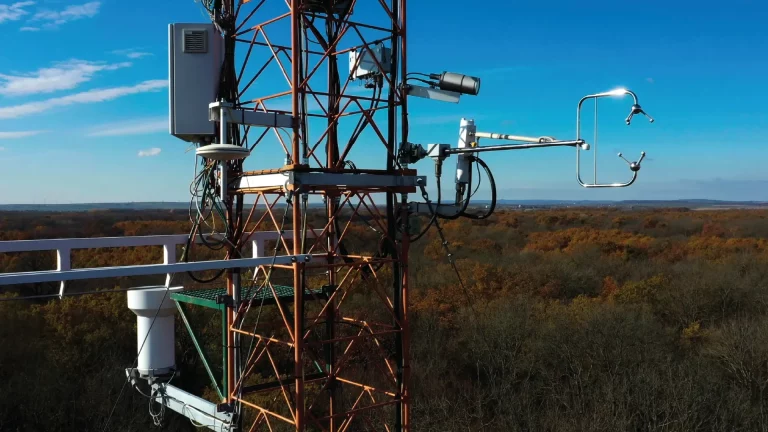
Tower weather station
Gusts, preceding rainfall and temperature on one timeline with the outage and damage records give a record of what each site actually experienced.
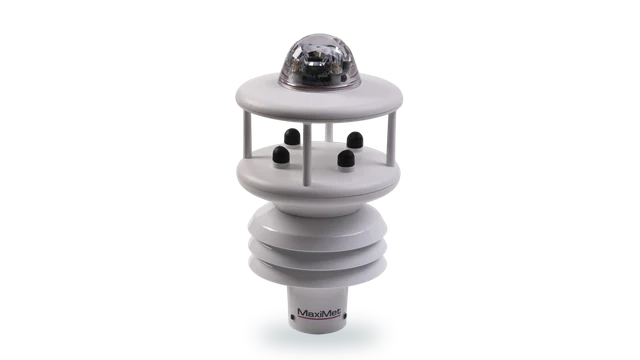
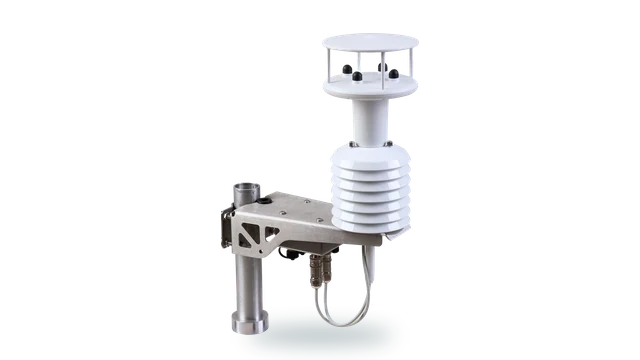
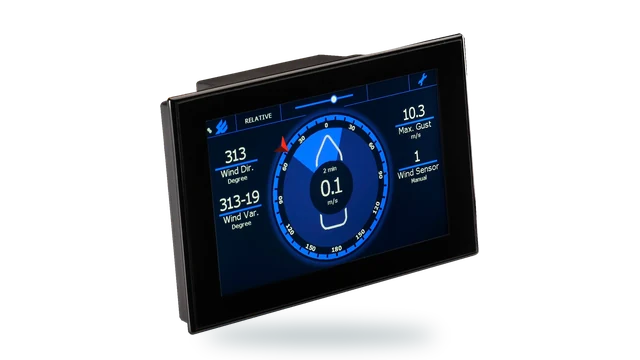
- MaxiMet GMX603 wind, temperature, humidity, pressure and optical rainfall in one unit
- MaxiMet GMX501 adds solar radiation in place of rainfall
Line-mounted and pole-top units
Integrators building line or pole monitoring units need wind sensing that is small, light and frugal with power.
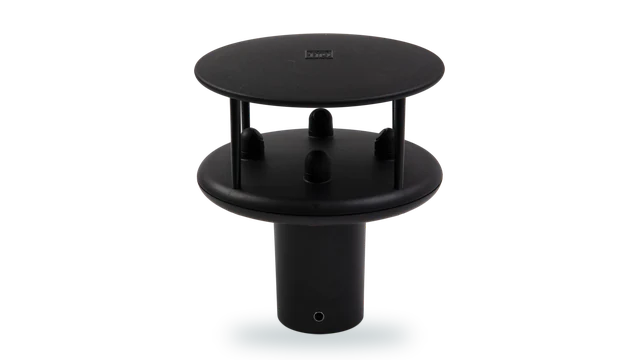
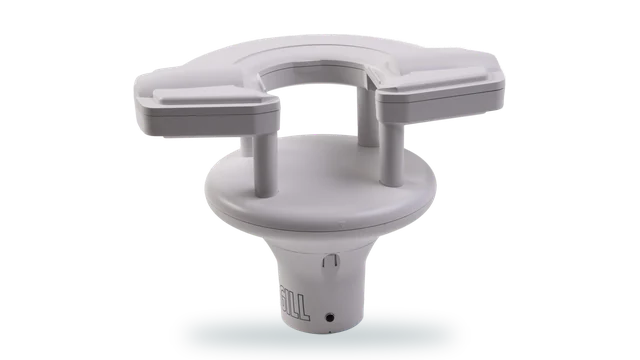
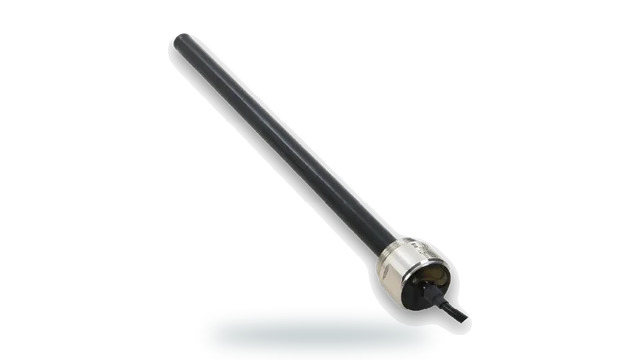
- WindUltra 270 g with its pole mount, IP69k, under 100 mW without heating in calm conditions
Gusts on the span
In a storm, wind speeds leave the comfortable middle of a sensor’s range. Accuracy published across the full range is what makes a storm record defensible.
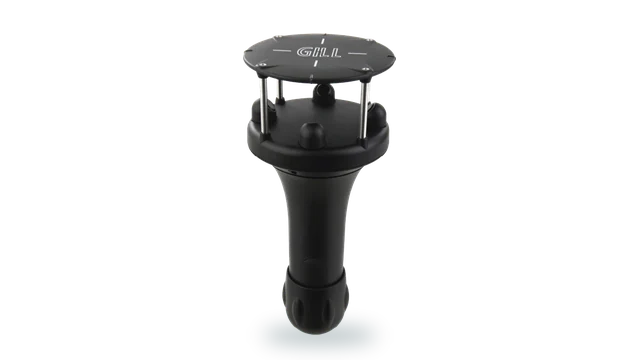
- WindSonic 75 0 to 75 m/s, under 5 per cent RMSE from 60 to 75 m/s
- WindObserver 90 0 to 90 m/s where the extremes justify it
Exposed and icing spans
Ridges and coasts see the worst wind and ice. A sensor that ices up stops reporting at the moment the line is loaded hardest.
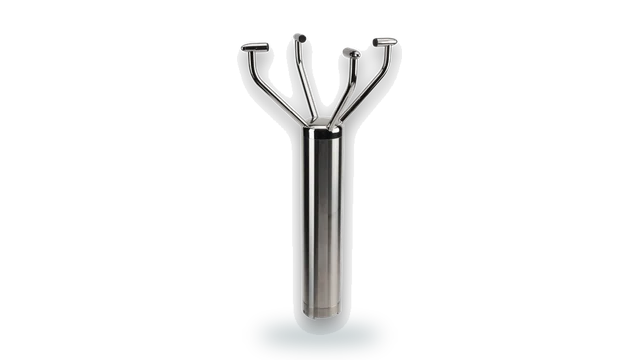
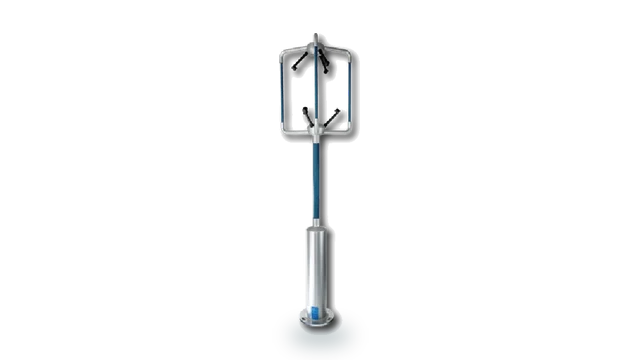
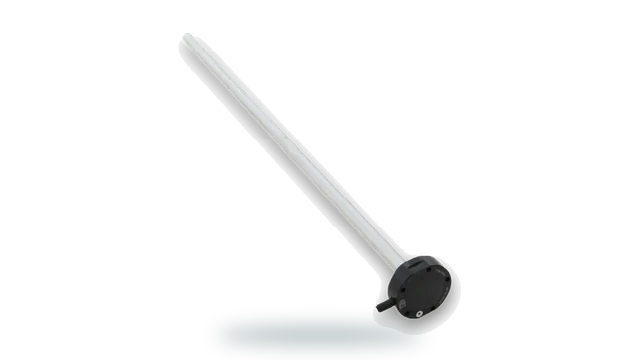
- WindObserver 75 heated 316 stainless open head, 0 to 75 m/s, IP66
- WindUltra heated as standard, IP69k, operating to -40 °C
Downbursts and complex terrain
Convective storms, downbursts and valley winds create conditions a distant station never sees. Where the flow is not level, 3-axis measurement shows the vertical component.
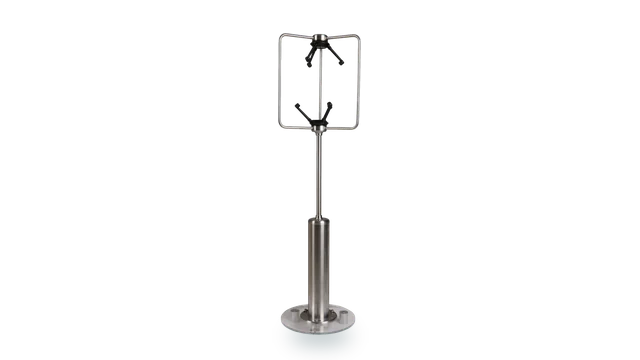
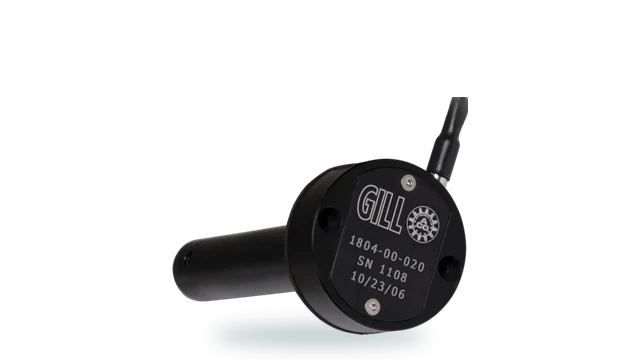
- WindMaster Pro 3-axis ultrasonic, U, V and W components, up to 32 Hz
The substation in the storm
During a storm, operations need to see what the weather is doing at each site as it happens, alongside outage and field records.
- MaxiMet native Modbus RTU into SCADA
- TruMet PW100 optical rainfall, 0.1 mm pulse
Crew safety at height
Before a crew goes up or out, the questions are simple: how hard is it gusting, how cold is it, is it raining? Measured at the work site, not for the county.
- WindSonic 60 compact 2-axis wind, 0.5 kg, IP66
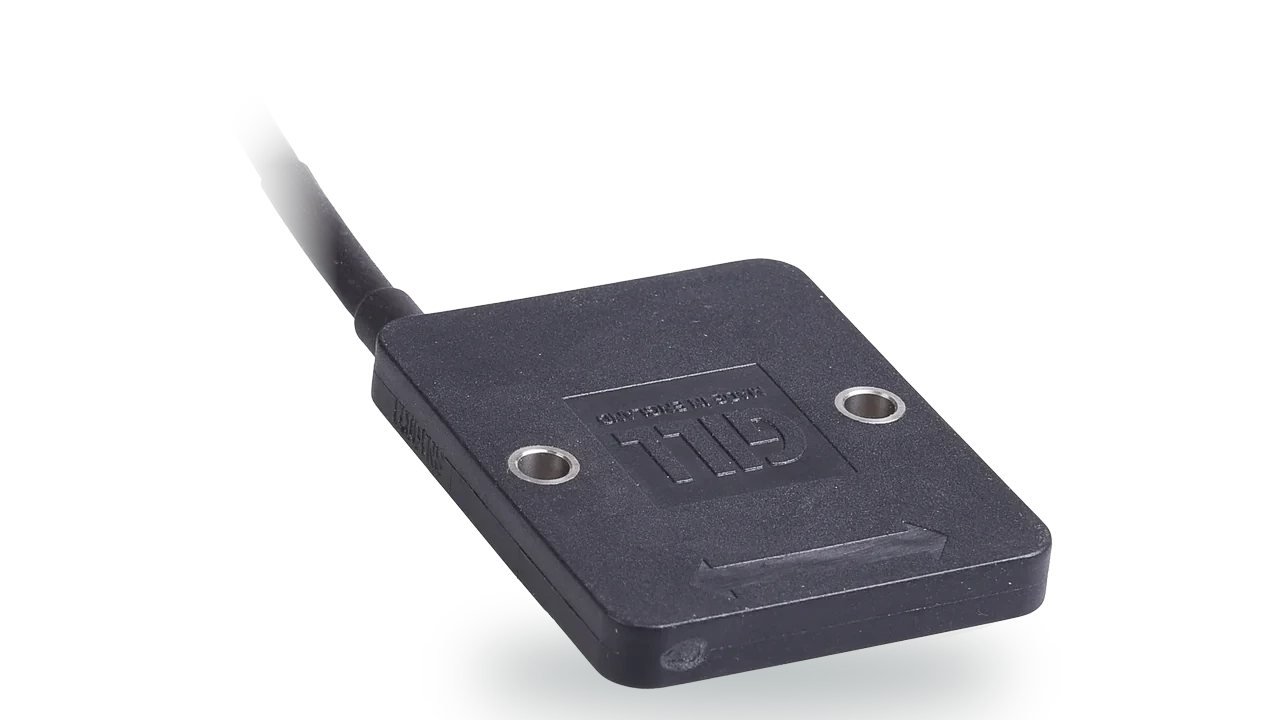
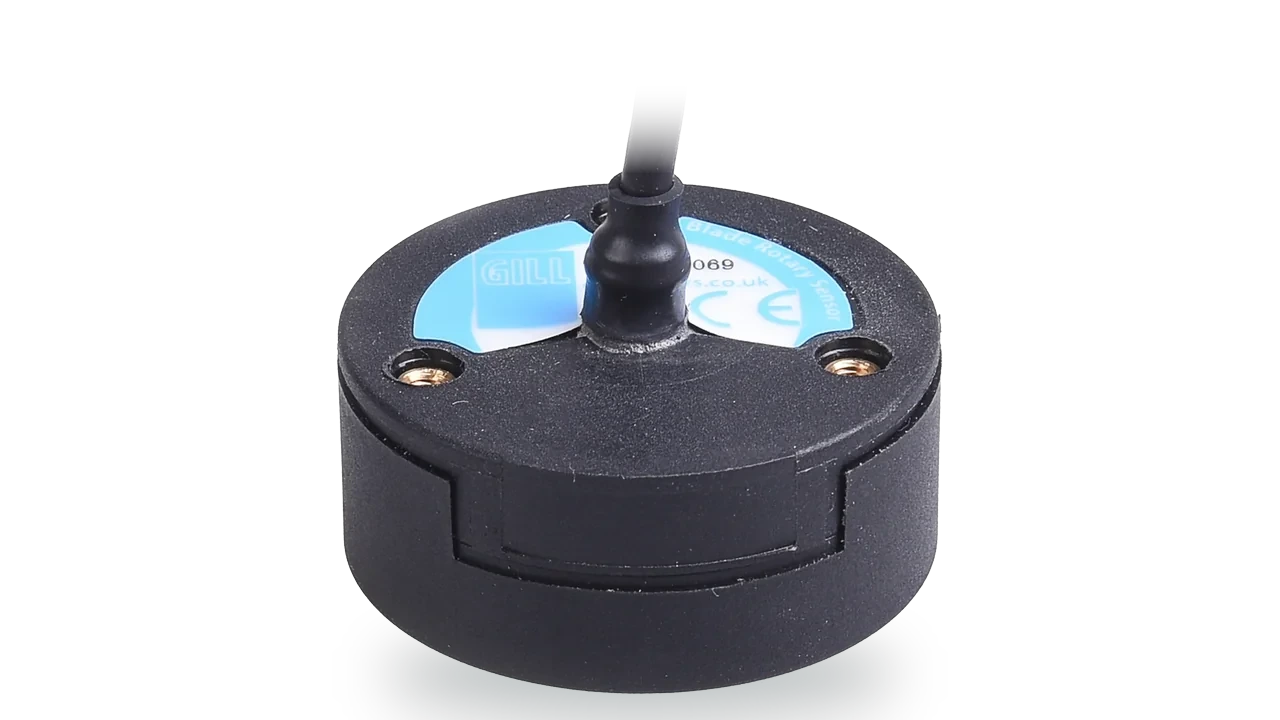
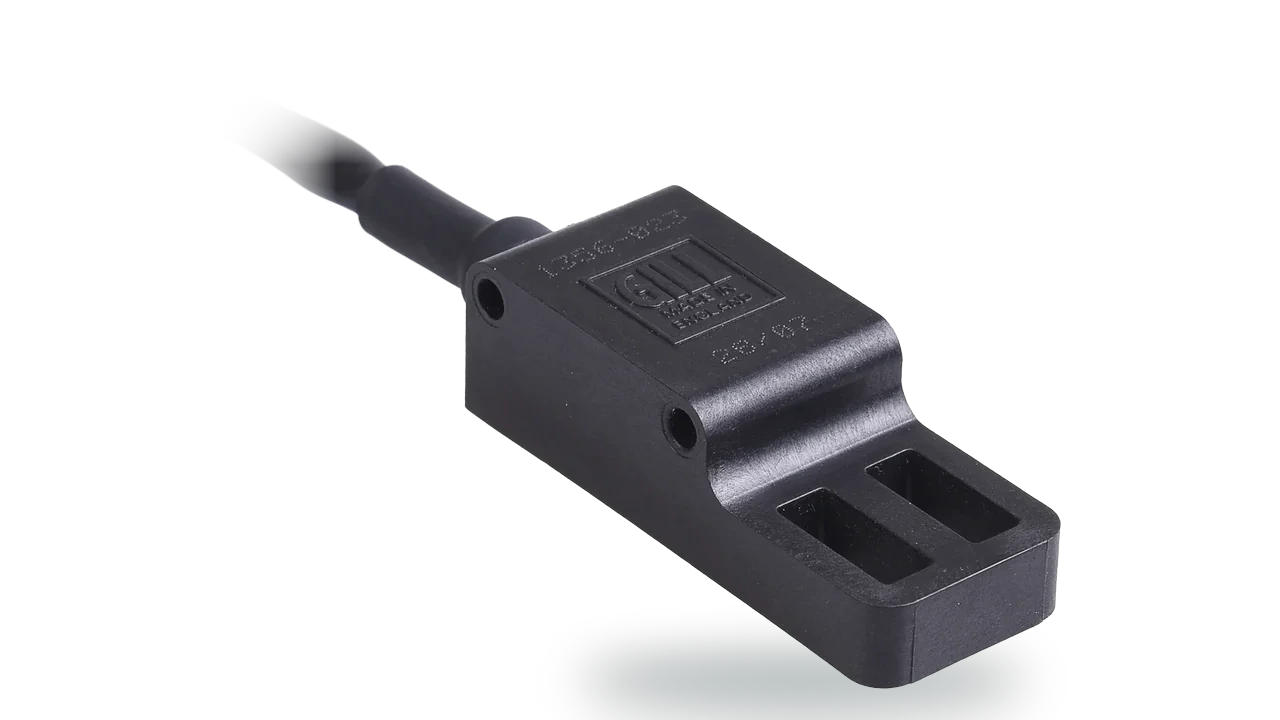
- Blade non-contact position feedback for booms and outriggers
Anemometer calibration
A storm record is only as credible as the instrument behind it. Labcal calibrates anemometers and air velocity instruments from any manufacturer.
- UKAS air velocity calibration anemometers and air velocity instruments, traceable to national standards
- Labcal, UKAS Lab 0625 ISO/IEC 17025:2017, for instruments from any manufacturer
Most wind sensors are specified at one speed. A storm is not.
A single accuracy figure at 12 m/s says little about a storm, which is exactly when wind speeds leave the middle of a sensor’s range. Gill publishes wind accuracy across the whole operating range for six products, rather than at one convenient speed: under 2 per cent RMSE or 0.2 m/s from 0 to 20 m/s, under 3 per cent from 20 to 60 m/s and, on WindSonic 75, under 5 per cent from 60 to 75 m/s. The figures come from independent wind-tunnel testing of multiple units of each product.
The six products specified this way are WindSonic 60, WindSonic 75, WindObserver 65, WindObserver 70, MaxiMet and WindUltra. For gusts on exposed infrastructure, WindSonic 75 measures to 75 m/s, and every Gill ultrasonic output carries a status code, so a failed sensor is never mistaken for calm.
Accuracy published across the whole range
Explore WindSonicBuilt for the places a line is hardest to reach
Gill wind sensors have been fitted to transmission towers in Australia, Northern Ireland, Uruguay and South Korea, and WindMaster has been used where the vertical component of the wind matters, including in Switzerland. Ultrasonic heads have nothing to wear, seize or ice to a halt, which matters on a tower that takes an outage window to climb.
WindObserver 75 heated 316 stainless steel open head, 0 to 75 m/s, IP66. WindUltra heated as standard, IP69k, operating to -40 °C, native Modbus RTU. WindMaster Pro 3-axis, where downbursts and terrain make the flow anything but level.
From the tower to the control room
Gill sensors provide native, open outputs: Modbus RTU over 2-wire RS485 on all fourteen MaxiMet models and on WindSonic Option 5, SDI-12, NMEA 0183, and a 0.1 mm rain pulse on TruMet PW100. Where an RTU already reads Modbus, it can poll the sensor directly.
For the substation end of the line, see substation weather monitoring, including how to bring a mast-mounted sensor into a control building safely.
Questions about overhead line wind and storm monitoring
Wind loads conductors and towers in storms, and it also cools conductors, which sets how much current they can carry. Measuring wind at exposed towers and spans gives a record of what each site experienced during a storm, evidence to prioritise hardening, and site-specific inputs to field safety and line rating decisions.
Regional observations describe the storm as a whole and are accurate for where they are, often airports. Convective storms, downbursts, valley winds and terrain create very different conditions over short distances, so they rarely explain why particular towers, spans or substations took damage while others did not.
The core variables are real-time wind gusts at the site, preceding precipitation and, where reliable data exists, icing conditions. Correlated on one timeline with outage and damage records, they show what each damaged site experienced. Vegetation, asset age, condition and design standards remain part of the analysis.
Most wind sensors are specified at a single reference speed, usually 12 m/s. Gill publishes accuracy across the whole operating range for six products, established by independent wind-tunnel testing: under 2 per cent RMSE or 0.2 m/s from 0 to 20 m/s, under 3 per cent from 20 to 60 m/s and, on WindSonic 75, under 5 per cent from 60 to 75 m/s.
Wind sensors do not measure ice accretion on conductors. Accurate ice measurement on lines is genuinely difficult and usually needs specialist sensors. What a heated wind sensor does is keep reporting wind in icing conditions, when an unheated mechanical anemometer may freeze, so the storm record stays complete.
Wind, gusts, temperature and relative humidity sit at the heart of fire-weather awareness. Measured locally, they give a utility’s existing risk assessment and operating procedures site-specific inputs during high-risk conditions instead of a regional estimate. The decision method stays with the utility’s own procedures.
For an asset question, measure at the height of the structure or conductor concerned rather than at the 10 m meteorological standard. Sensors are commonly mounted on towers, gantries, separate masts near exposed spans or inside line-mounted units, and exposed ridges, coasts and valleys often need their own measurement.
Ultrasonic wind sensors have no cups, vanes or bearings, so there are no moving parts to wear, seize or replace, which reduces climbs and outage windows. They still benefit from periodic inspection and calibration checks. Labcal, an independent UKAS-accredited laboratory within Gill Group, calibrates anemometers from any manufacturer.
Measuring wind and weather on an overhead network?
Tell us the lines, the sites that worry you and the systems the data has to reach. We will tell you plainly what we would measure, where, and with which output.
We aim to respond in one working day.